


A Time Series Analysis of Cryptocurrency, Safe Stocks, and the S&P 500
Introduction:
In the diverse world of investments, understanding the risk-reward profile of different asset classes is crucial for investors looking to optimize their portfolios. The inception of Bitcoin introduced a new asset class with distinctive characteristics, prompting a fresh look at its performance relative to traditional stocks and market indices. This article delves into an analytical comparison between Bitcoin, a representative tech stock (Apple Inc.), and the broader market (S&P 500), providing insights into their interrelated movements and individual risk profiles.
Understanding Asset Volatility:
Before we dive into the specifics, let’s address the elephant in the room – volatility. Bitcoin has been a poster child for extreme price movements, making headlines with its meteoric rises and sharp declines. On the flip side, Apple, as a blue-chip stock, exemplifies stability and steady growth, while the S&P 500 serves as a benchmark for the overall market.

The Data Story:
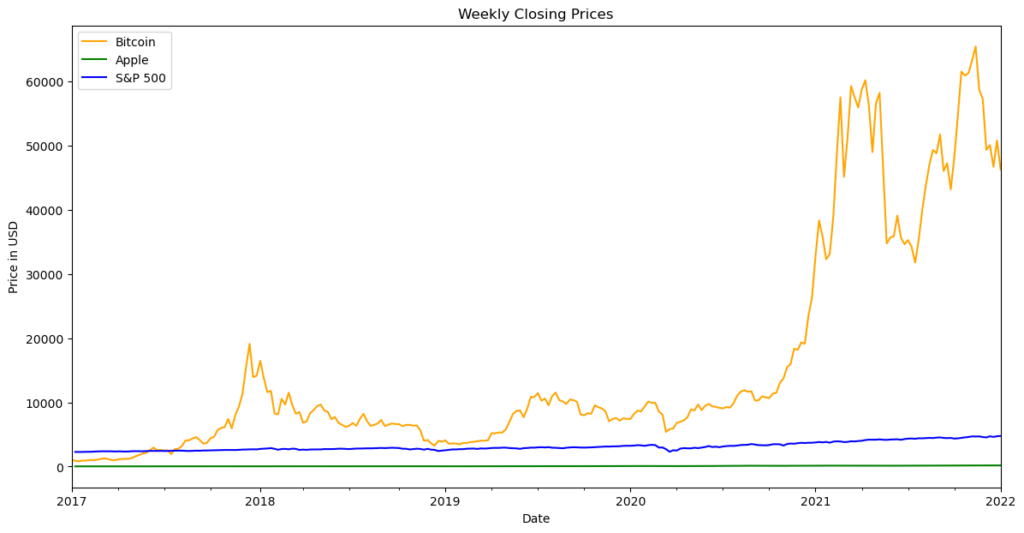
Our analysis began with an in-depth look at historical prices, using data from 2017 to 2022. We chose weekly closing prices to focus on longer-term trends, filtering out daily noise. This approach is particularly beneficial for investors interested in understanding the broader trajectory rather than day-to-day fluctuations.
From Prices to Returns – The Transformation:
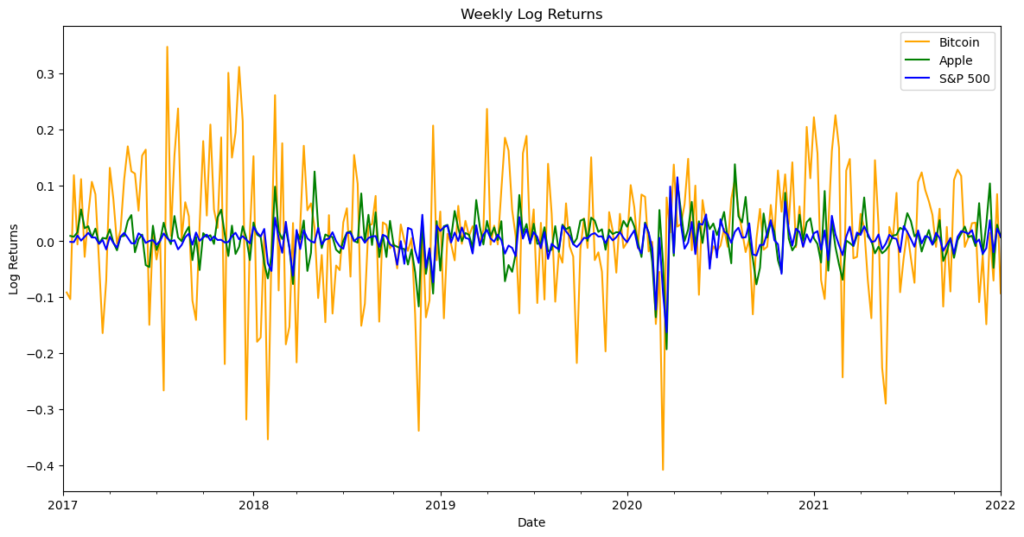
Price data alone doesn’t tell the full story. To compare apples to apples – pun intended – we transformed the prices into log returns. This mathematical maneuver not only normalizes the data but also stabilizes variances, making it suitable for statistical analysis.
The Nitty-Gritty of Regression Analysis:
Our study utilized the Capital Asset Pricing Model (CAPM) as a framework to assess the risk-return dynamic. By running an Ordinary Least Squares (OLS) regression, we estimated how Bitcoin’s returns responded to market movements, represented by the S&P 500, aiming to uncover the hidden layers of Bitcoin’s risk profile.
The Results Unveiled:
Bitcoin’s beta, a measure of its responsiveness to market movements, stood at 0.6328, indicating a moderate correlation with the market. The alpha, while not statistically significant, was positive at 0.0134, hinting at the potential for returns above the market rate. However, the R-squared value of 0.018 suggested that market movements only explain a small fraction of Bitcoin’s price behavior. This paints a picture of Bitcoin as an asset influenced by a variety of factors beyond just market trends.
Interpreting the Statistical Speak:
The F-statistic confirmed the model’s overall significance, while the Durbin-Watson statistic indicated no concerning autocorrelation in the residuals. However, the Jarque-Bera test pointed towards non-normality in the residuals, a common trait in financial time series data due to heavy tails.
Final Thoughts:
This analysis provides a data-driven narrative of risk and return in the context of Bitcoin, Apple, and the S&P 500. It underscores the importance of diversification and understanding each asset’s unique behavior. For the risk-takers, Bitcoin offers an exciting but unpredictable ride. Apple stands as a bastion of stability, and the S&P 500 continues to be the pulse of the market’s health.
As we continue to witness the evolution of financial markets, with cryptocurrencies and traditional stocks vying for investors’ attention, it’s clear that a well-informed strategy is more crucial than ever.
Closing Remark:
We encourage readers to engage with the data, challenge the norms, and partake in the ongoing dialogue about the future of investing. Whether you’re a seasoned investor or a finance enthusiast, the journey through the landscape of assets is as thrilling as it is enlightening.


Do you know if you are ready for the blockchain project?
Analyzing aspects of the use case against readiness for the blockchain project isn’t simple task, but there is a group of indicators if the blockchain can abring value to your idea. I presented 6 of them with descriptions. I hope they helped a the general blockchain or non-blockchain direction.
 Bitcoin
  Ethereum
  Tether
  BNB
BNB  XRP
XRP  USDC
USDC  Solana
  Figure Heloc